Skip to content

Showcase

This page is the visual entry point for the running kensan-lab platform. The repository is a reference architecture, but it is also a live system — these views are the proof.

Six views tell the story: the physical bare-metal cluster, deployment health (Argo CD), observability (Grafana), the developer platform (Backstage), zero-trust network visibility (Hubble), and the app the platform exists to run.

Hardware — bare metal, literally

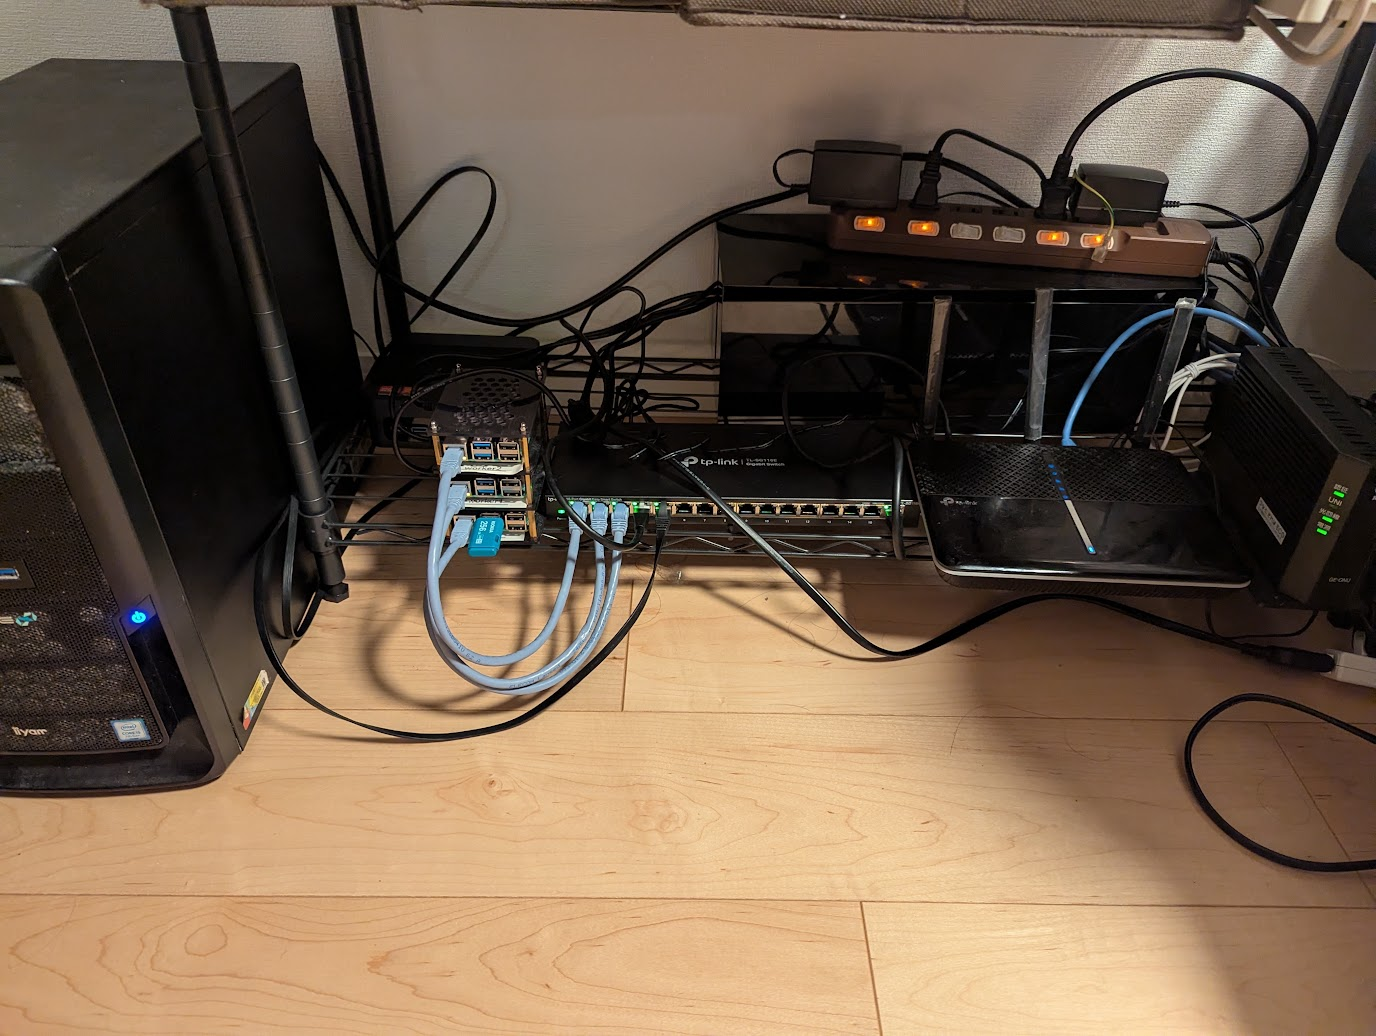
The physical kensan-lab cluster — a stacked Raspberry Pi 5 trio, the M4 Neo worker, and a TP-Link TL-SG116E switch
The platform behind the dashboards: three Raspberry Pi 5 nodes and one amd64 worker, connected through a managed switch. The architecture in this repository runs on this hardware.

Argo CD — the cluster is GitOps-managed

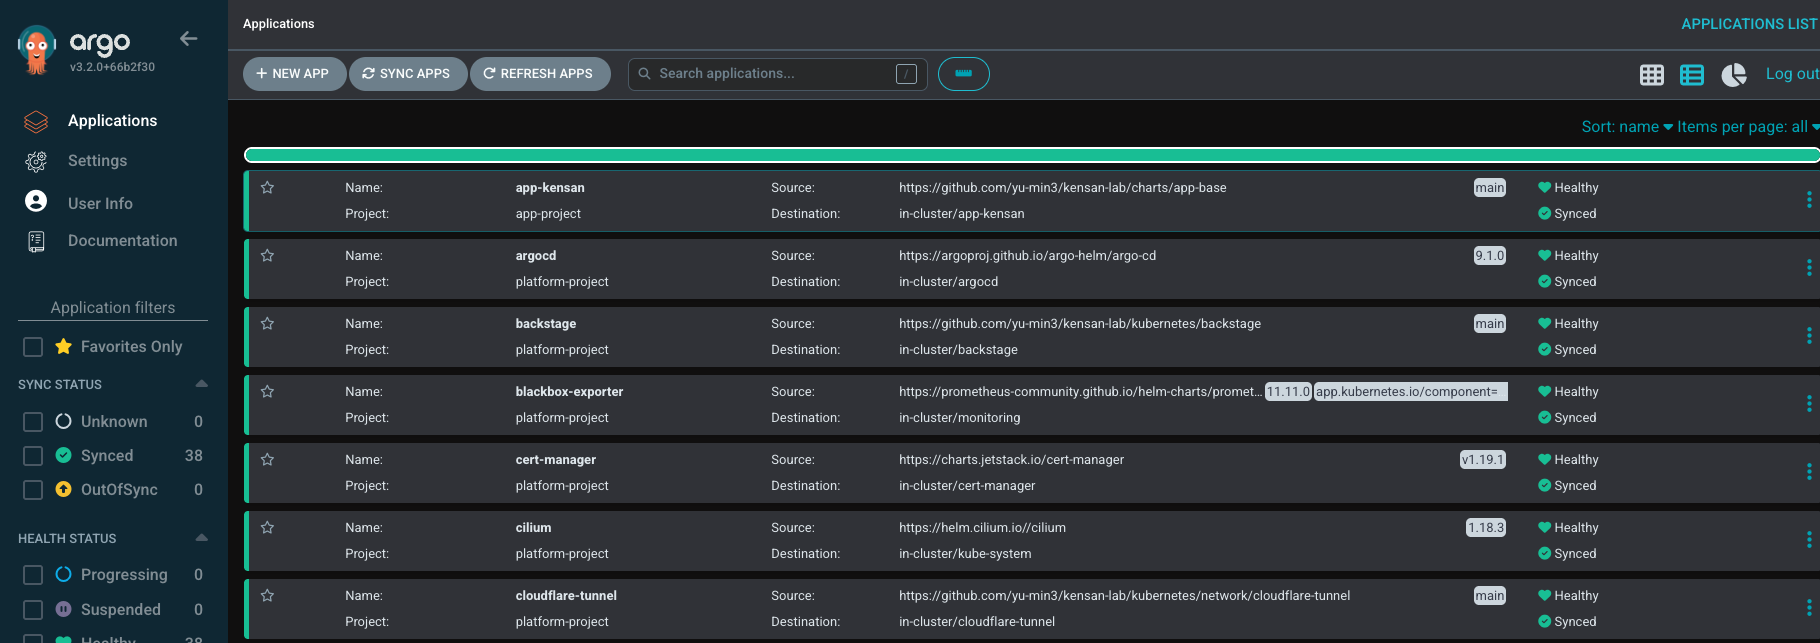
Argo CD applications list — 38 applications Synced and Healthy, 0 OutOfSync, across platform-project and app-project
Every platform and app component reconciled by Argo CD — 38 Synced / 0 OutOfSync. A live GitOps system, not static manifests.

Grafana — the operational layer

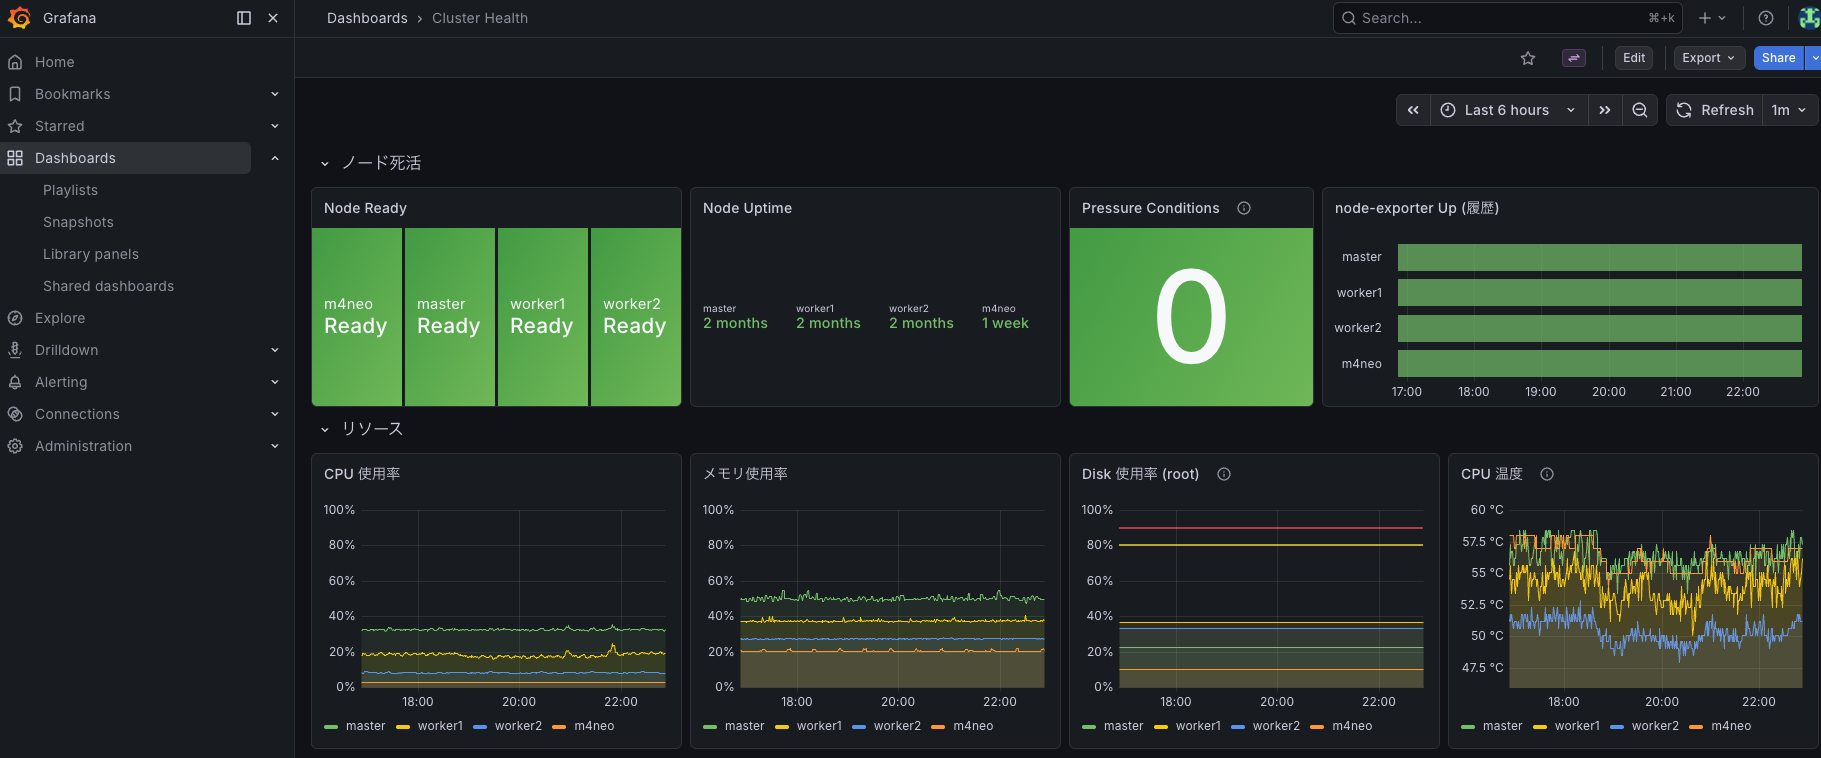
Grafana Cluster Health dashboard — node liveness, uptime, pressure conditions, CPU/memory/disk, and Raspberry Pi CPU temperature
Cluster Health: node liveness and resources across the Pi 5 nodes and the amd64 worker — including the CPU-temperature panel that hardware reality demands.

Backstage — the Internal Developer Platform

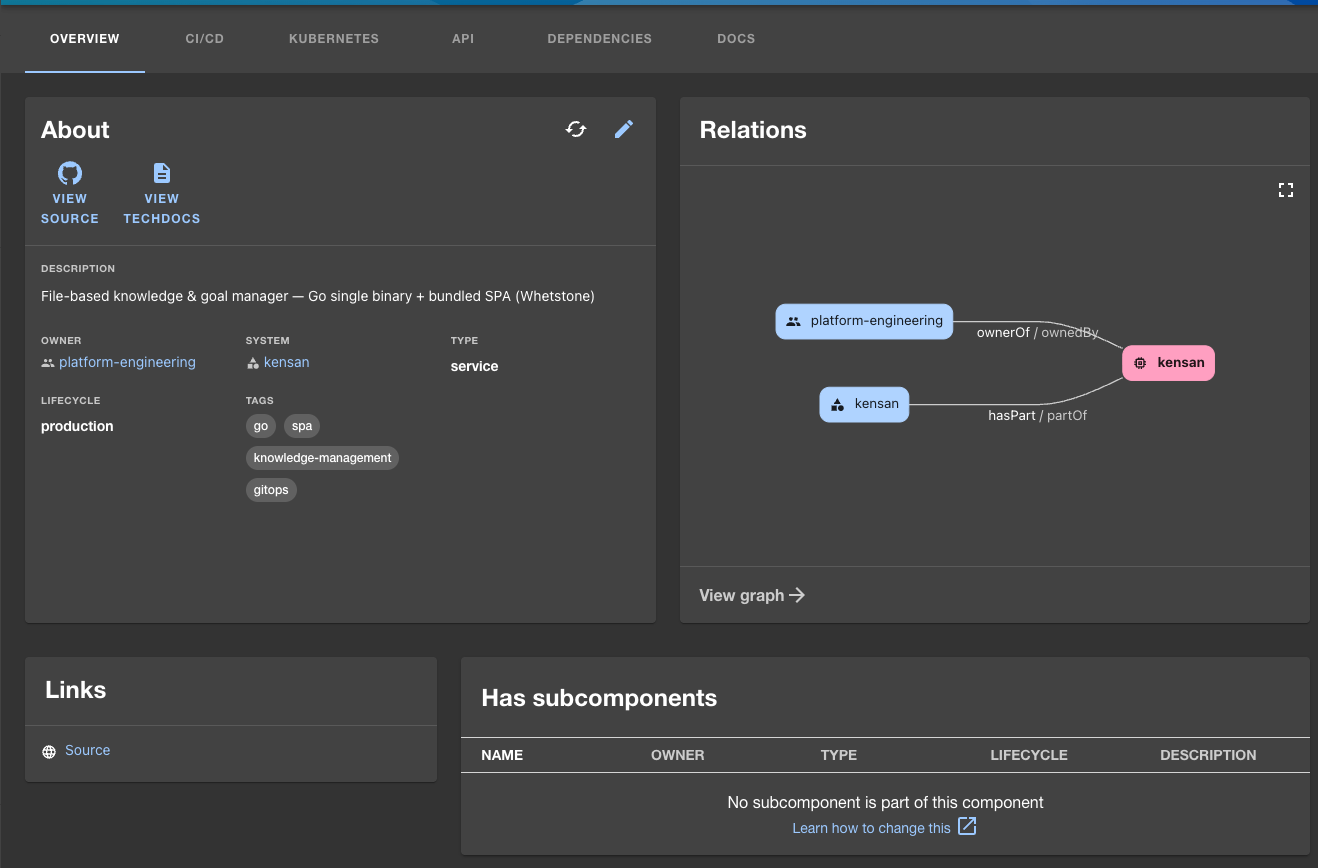
Backstage entity page for the kensan component — About panel, ownership, tags, a Relations graph, and a TechDocs link
The kensan component in Backstage: ownership and system, a live Relations graph, and one click to its TechDocs — the catalog that turns "what runs here" into self-service.

Hubble — zero-trust network visibility

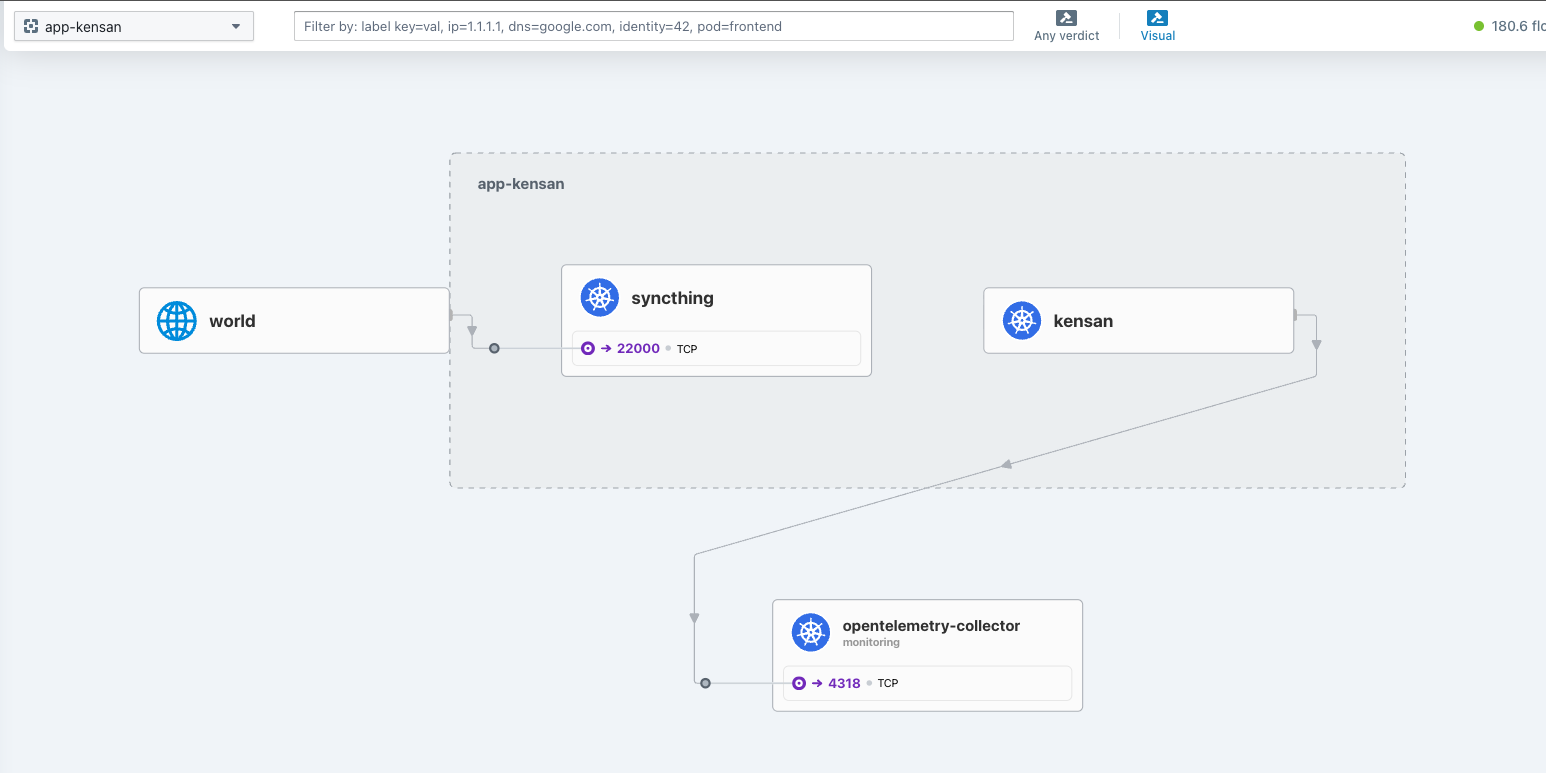
Hubble UI service map for the app-kensan namespace — flows from the outside world to Syncthing and from the kensan app to the OTel Collector
Cilium/Hubble makes every service-to-service flow observable — here app-kensan's real traffic: Syncthing sync in, telemetry out to the OTel Collector.

kensan — the app that runs on the platform

kensan is not the point of this repository — the platform is. It's a dogfooding workload: a real app that exercises the platform end-to-end (deployed by Argo CD, cataloged in Backstage, secured at the Gateway, observed like any other service), so the platform is proven against something real rather than a toy.
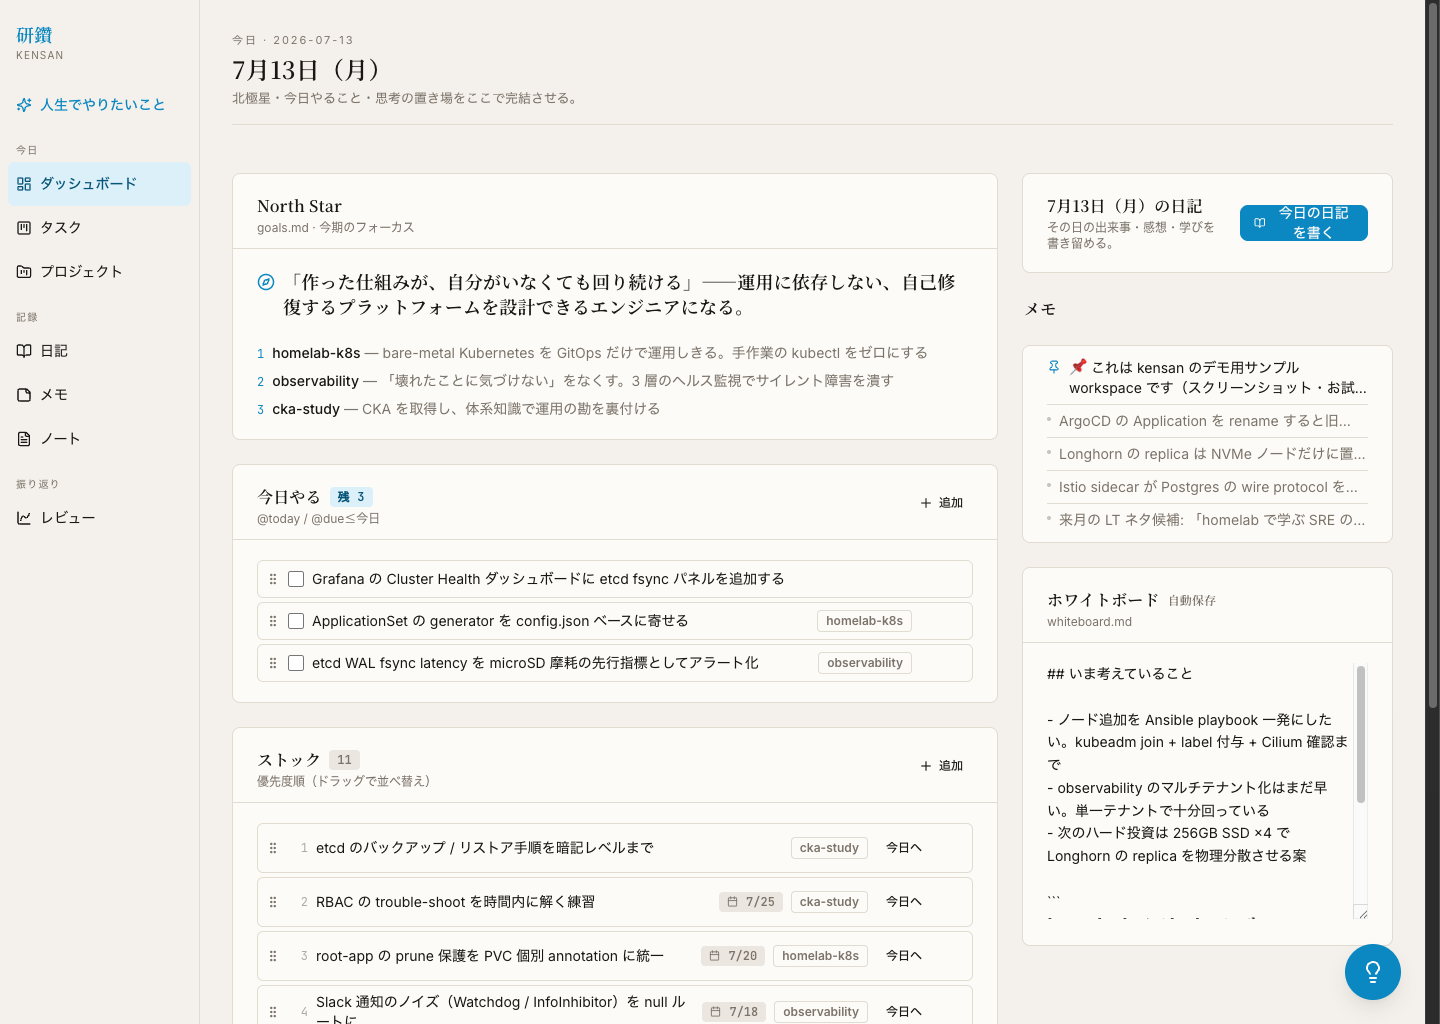
kensan dashboard — North Star and quarterly focus, a today lane, a prioritized backlog, memos, and a whiteboard, rendered in the Whetstone design system
kensan (Go single binary + Whetstone SPA), a file-based knowledge & goal manager that reads Markdown as its single source of truth. Shown with a sample workspace — fictional data, not a live view. The UI is the author's personal tool and is currently Japanese-only (see demo-workspace to run it locally).
Capture guidelines (for contributors adding new screenshots)
  • Use real running screens only. No mock dashboards or generated images.
  • Redact domains, user names, tokens, cluster IDs, and IP addresses that are not already public.
  • Prefer a 16:9 browser viewport around 1440px wide; save as PNG.
  • Keep captions outcome-focused: what the screen proves, not how to operate the tool (the captions above already follow this — adjust only if the shot differs).